Reports & Analytics
Numbers tell a story. The reporting section in Salonnare gives you a clear picture of how your salon is performing -- from daily revenue to staff productivity to client trends. No spreadsheets required.
Finding Your Reports
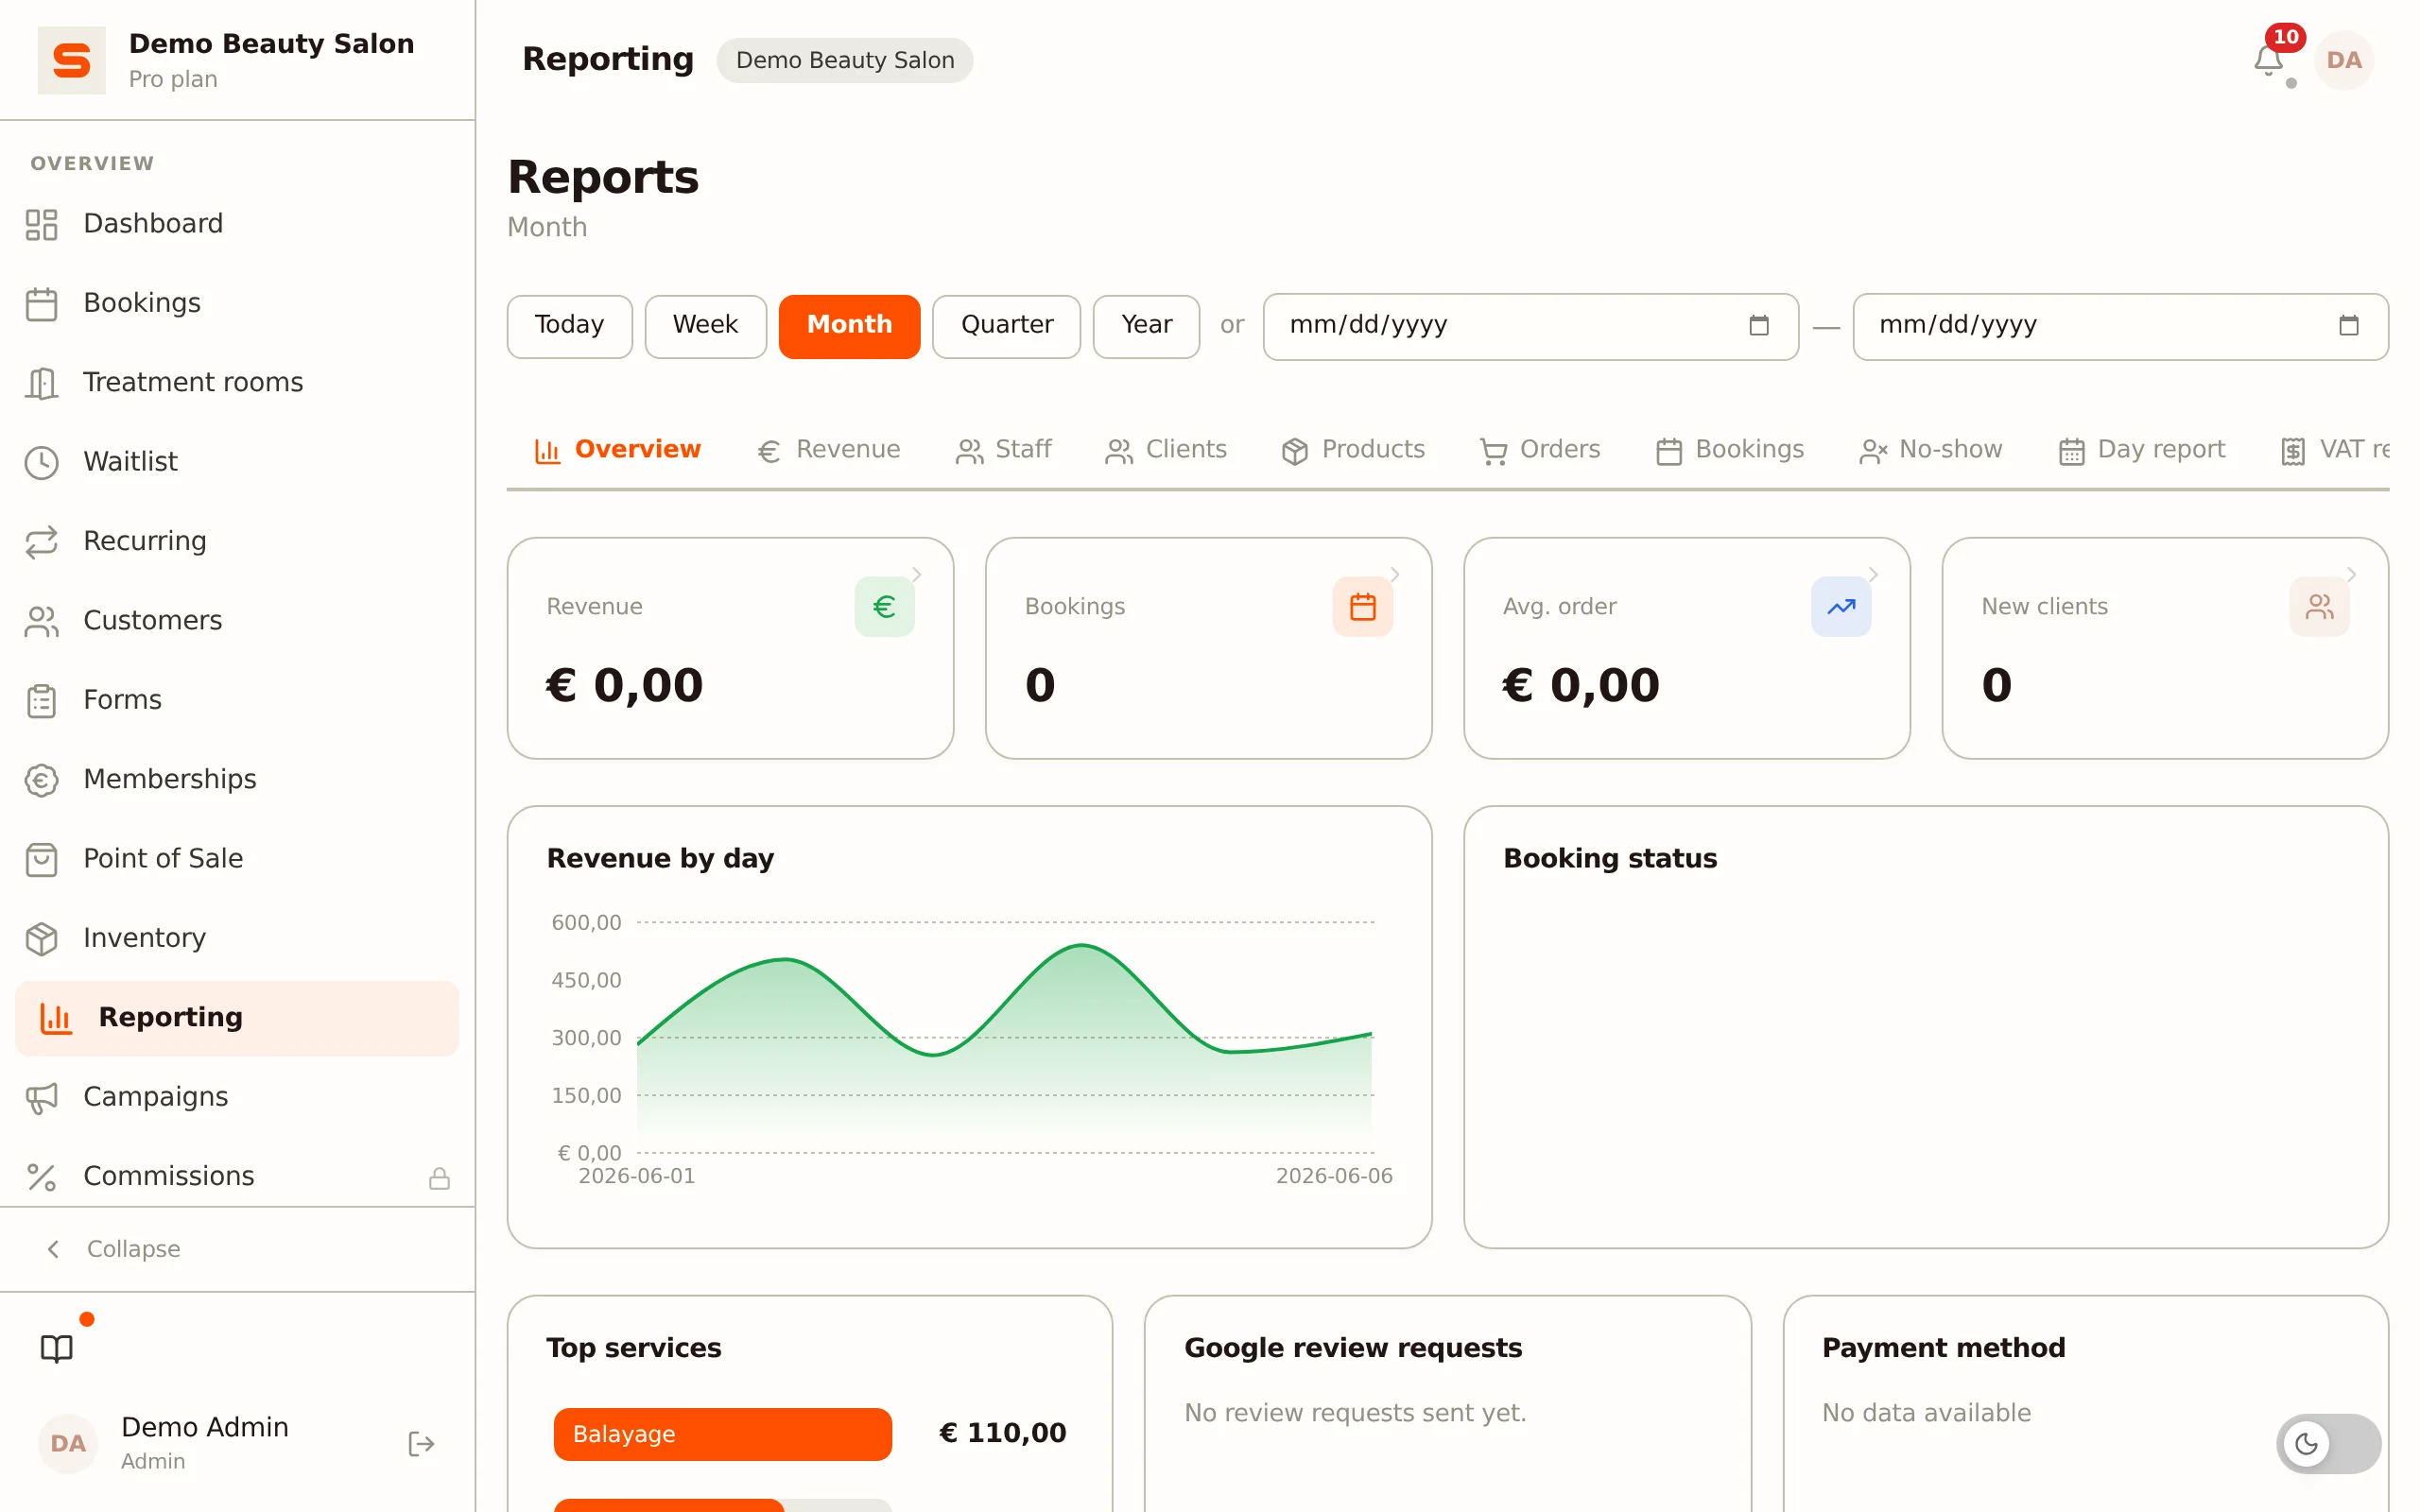
Go to Reporting in the sidebar. The page is organised into tabs, with one shared period picker at the top.
Choosing the Period
At the top you set the period that applies to every tab:
- Quick presets: Today, Week, Month, Quarter, or Year.
- Or a custom from/to range.
The default period is the current month. When you switch tabs, the selected period stays in place.
The Tabs
Overview
Your starting point with the key figures at a glance: Revenue (expandable, including the part that comes from deposits), Bookings, Avg. order and New clients, with a trend comparison against the previous period. Below that, revenue per day, the booking status and the most popular services. The busy-times heatmap lives on the Bookings tab.
If the previous period was zero or negative (for example because of refunds), no trend percentage is shown: comparing with zero or a negative amount says nothing.
There is also a Reviews card: the average rating over the chosen period with the most recent reviews below it. Click the card to open the full list under Settings > Marketing > Reviews. Only public reviews are counted, so the rating matches what clients see on your salon page.
Revenue
Your revenue over the chosen period as a chart, with a Compare previous period button that lays an equally long previous period underneath as a dotted line. Plus the average transaction value, the split per payment method and revenue per service and per product. Handy for spotting trends early.
Each payment method shows its net amount: what came in minus what was refunded with that method. If you refund a card receipt in cash, that money leaves the cash drawer and cash can end up negative for the period. Such a method gets no slice in the ring and shows 0%; the amount itself stays visible. The percentages cover the methods that brought in money on balance and add up to 100%. The centre shows the net revenue for the period.
Staff
Per team member: revenue generated, number of appointments, utilisation and average rating. Useful for setting goals, performance conversations, or balancing the workload.
Clients
Understand your client base: new and returning clients, retention and average visit frequency, your top 10 clients by spend and a list of lost clients who have not been in for a long time.
Products
Your best-selling products and product revenue over the period.
Orders
A searchable, paginated list of all POS orders. Filter by staff member and payment method.
Bookings
A paginated list of all appointments, with a busy-times heatmap by day and hour above it plus the Total appointments and Cancellation rate figures.
Filter by staff member, service and status. The filters apply to the whole tab: the list, the heatmap and both figures show the same selection.
- Service: every appointment that includes that service counts, even when it is not the first service of the appointment.
- Status: without a status choice the heatmap leaves cancelled and provisional appointments out. Pick a status yourself and the heatmap shows exactly that one, including Cancelled or Provisional.
The chosen filters live in the web address, so a refresh keeps them and you can share the link with a colleague.
No-show
If you have no-show fees enabled: the total number of no-shows, how much was charged, and how much of that was paid. Below that are the clients with the most no-shows; on an equal count the client with the most recent no-show comes first.
Day report
A daily overview (register report) of the revenue and transactions on a chosen day.
VAT return
An overview of revenue per VAT rate, so you can fill in your VAT return easily.
Internal Use
Only visible if you use internal use. Here you see what the products you wrote off as internal use in the chosen period cost: the total cost, the number of write-offs, the average per day and the product with the highest cost. Below that are a chart of the cost per day (per week for a long period) and tables by product, by staff member and by category. Click a column header to sort; Export CSV downloads the table by product.
The amounts are purchase prices excl. VAT. Each write-off uses the purchase price the product had at that moment. If it had no purchase price then, Salonnare uses the product's current purchase price. If the product has no purchase price at all, it shows no purchase price and those units are not included in the cost; the top of the tab tells you how many units that is.
Export
This is where you export reports as CSV or PDF (revenue, clients, staff, bookings, orders). At the bottom of this tab you also find the Accounting Export -- if your salon has access to it.
Audit Log
A timeline of what happened in your salon system: who changed what, and when. Useful for tracking down when a booking was edited or when a setting was changed. The log follows the period at the top and you can filter by entity type, action and user. Only admins see the contents. More in Audit Log.
Check the Overview tab at the end of each week. It only takes a minute and helps you spot trends early -- like a slow week that might need a promotion to fill empty slots.
Drilling Down into the Details
The tables in the reports are interactive. Right-click a cell (or long-press on mobile) for actions such as exporting the row or jumping to the related record -- for example to the order in the register, the appointment in the calendar, or the client profile.
Exporting Reports
Need to save or share a report? Open the Export tab and choose CSV or PDF for the report you need. The export uses the period you set at the top.
If you need formatted exports for your accountant (like Exact Online or Moneybird format), check out the Accounting Export article.